
Clientish Documents
Step-by-step guides for every module, from your first workspace to proposals, billing, support and automation.
Dashboard Charts
Revenue overview, Order status, Support tracker and Coming up.
Below the cards, charts show how revenue, orders and support develop over the chosen period.
Overview
This guide explains each chart on the Dashboard and what it counts.
Who Can Access
Revenue Overview
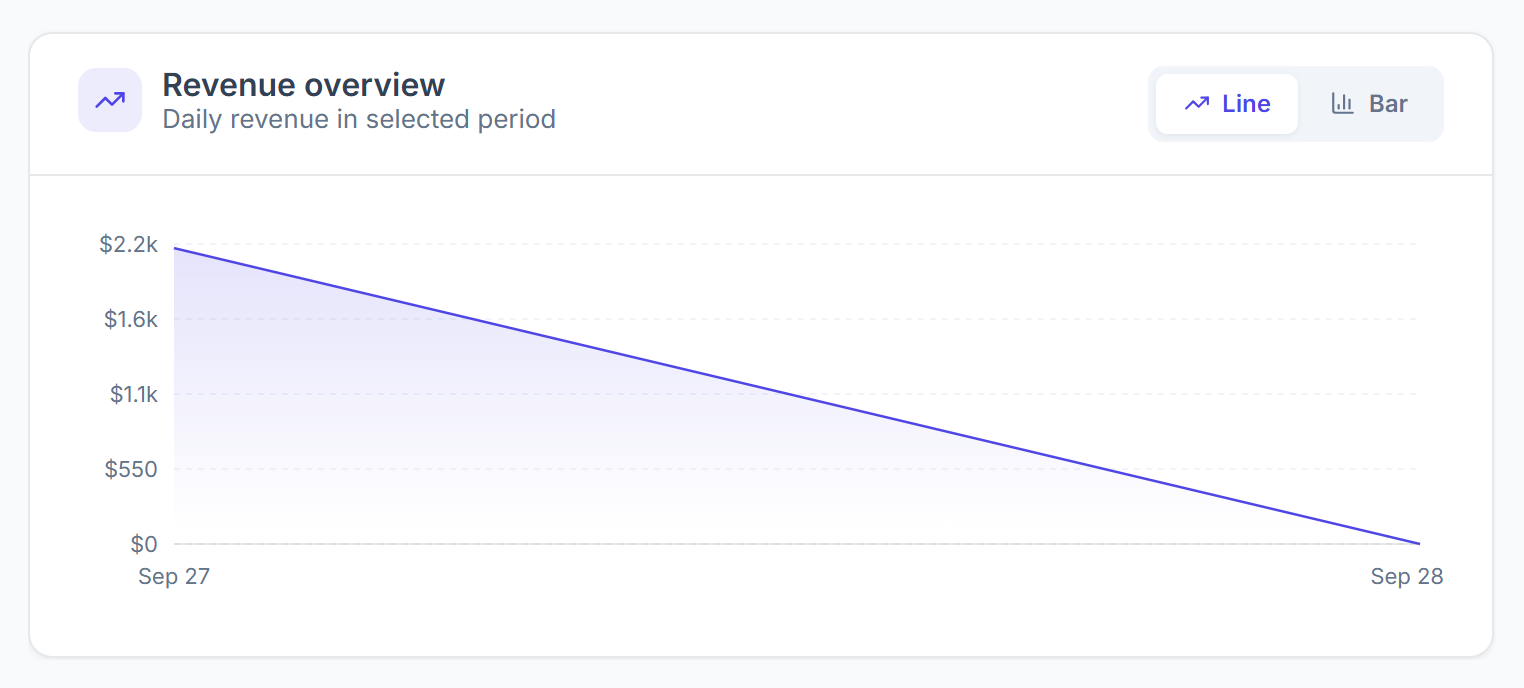
Revenue from paid invoices over the chosen period. Switch between Line and Bar at the top right. The chart shows one point per day, per week for ranges over 62 days, and per month for ranges over 180 days.
Order Status
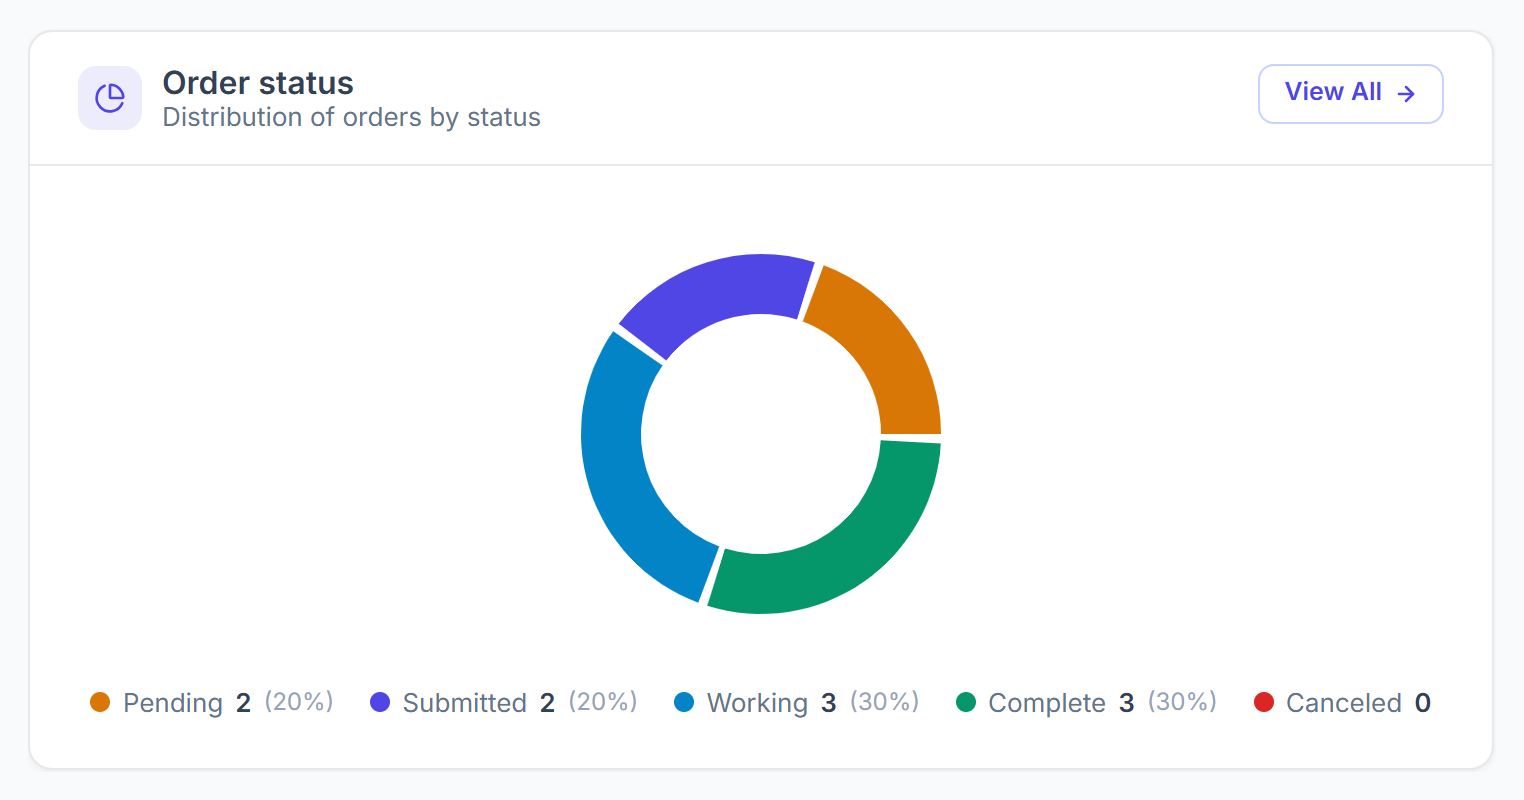
How your orders are spread over the five statuses: Pending, Submitted, Working, Complete and Canceled, with the number and share of each. View All opens Orders.
Support Tracker
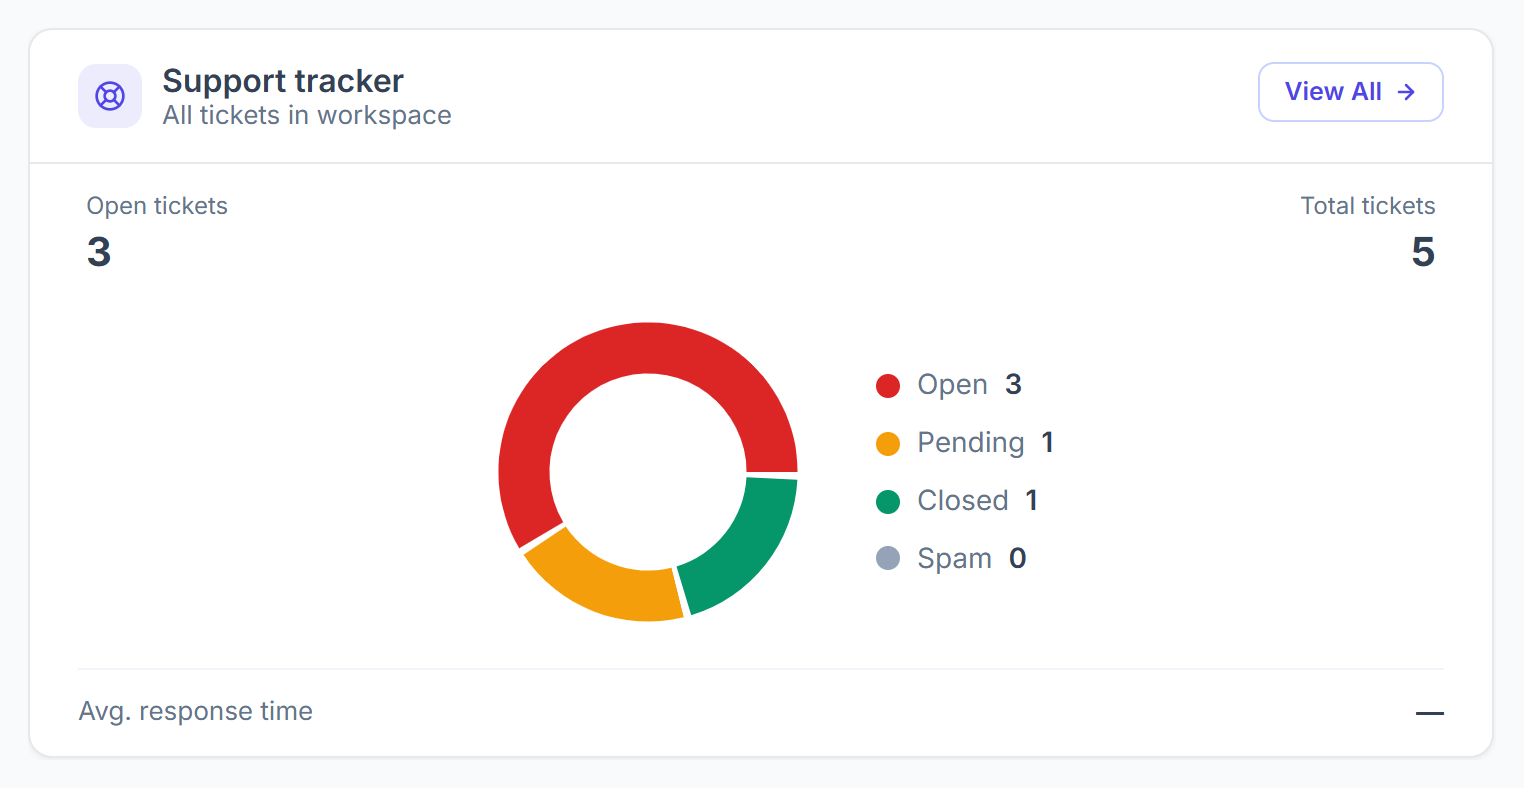
Your tickets at a glance: how many are open, the total, a breakdown into Open, Pending, Closed and Spam, and the average time to the first reply from your team. View All opens Tickets.
Coming Up
If you have connected Google Calendar, a Coming up card lists your events for the next 7 days. Events that Clientish added are tagged. See Connect Google Calendar.